Establish the *quarterback* run.
By Laura Stickells | December 18, 2020
I was listening to the Ringer NFL Show’s recap of the Patriots' blowout loss to the Rams last Thursday and was intrigued when Warren Sharp said that Cam Newton plays better when he’s allowed to run.
“I thought this game plan from the Patriots was kind of trash,” Sharp said.
“They should know by now what Cam Newton is... He is a front runner and he’s been that way for a number of years. If you get him started in the game and you get him feeling good about himself and you get him running into the endzone a little bit, he is going to be out there celebrating and having a good game and playing with his head in the game. If you just hand the ball off to running backs non-stop and have him throw the ball on third-and-long, he’s going to look terrible and he’s not going to feel like part of the game and he just loses confidence.”
I am not inclined to call a Bill Belichick game plan “trash” — seems like a trap — but I looked at the data to see for myself. And if Warren is right, could this be true for other quarterbacks, too?
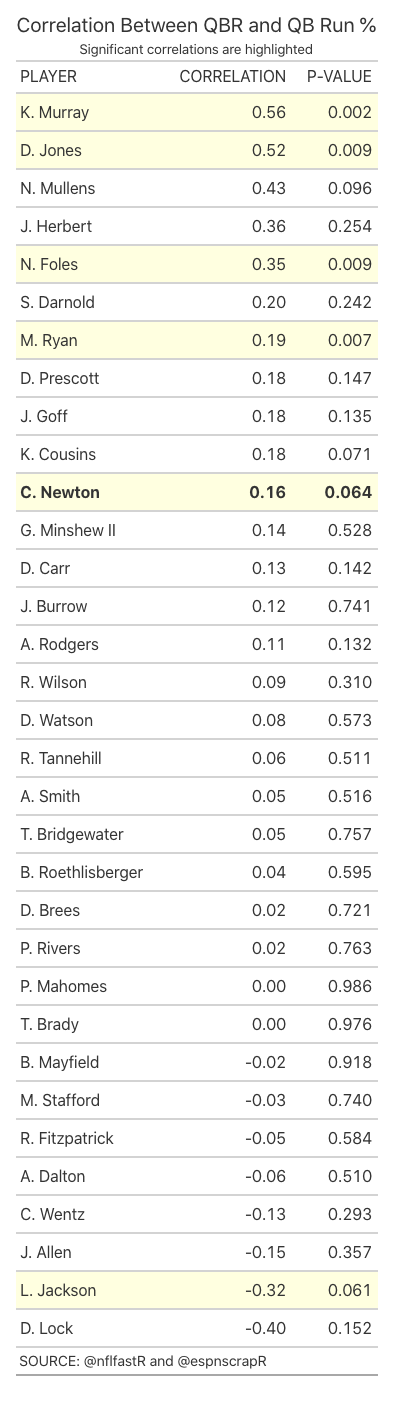
I started by checking if there is actually a statistically significant correlation between Newton’s Total QBR and the percent of quarterback runs* for all of the games in his career. And sure enough, there is a slight positive correlation of .16 with a p-value (statistical significance) of .06, which isn’t too bad.
I wanted to see if this was true for other quarterbacks and predicted that Lamar Jackson might follow a similar trend. But what I found was actually the opposite — a statistically significant negative correlation (-0.32). This suggests that the more Jackson runs the ball, the worse he performs.
I made a correlation table with p-values for all of 2020’s quarterbacks with 10 or more games since 2006 (the beginning of QBR) to see who else has a statistically significant correlation. Kyler Murray, Nick Foles, Matt Ryan and Daniel Jones are the only other quarterbacks with a statistical significance greater than Newton’s and Jackson’s.**
I compared Newton’s run percentage with his QBR for each game this season and was surprised to see how closely the two mirror each other. I graphed Newton’s QBR for 2020 and plotted colored dots over each game — the greener the dot, the higher his QBR. In four of the five games where Newton’s rush percentage was above his season average (19.6%), he also performed above his average QBR. Also, New England won four of the five games where Newton’s rushing percentage was greater than 20%. (Click on each game for game results.)
I made the same graph for Jackson, Murray and Jones to see if they could pass a similar eye test, and they do. You can check it out for yourself by switching the selected quarterback in the graph above. I didn’t bother for Ryan and Foles because they’ve hardly run the ball this season, so a single season graph wouldn’t prove much.
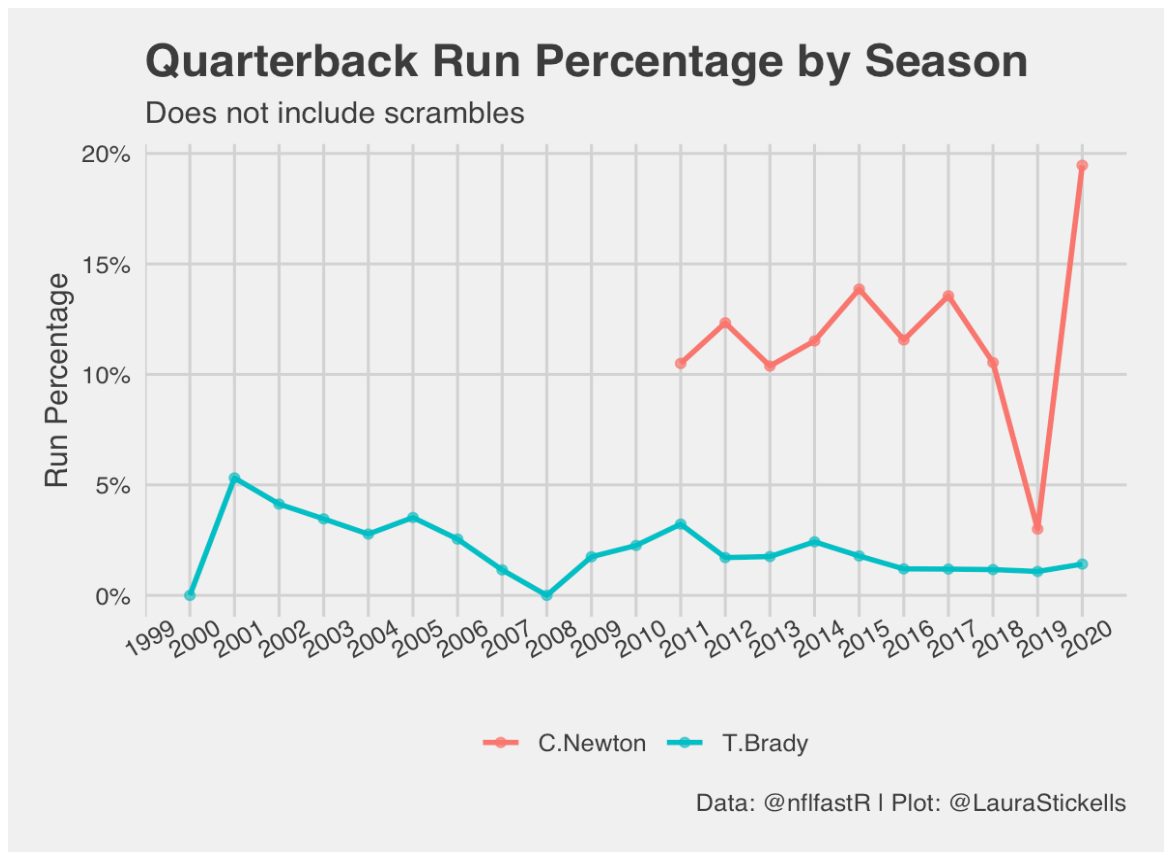
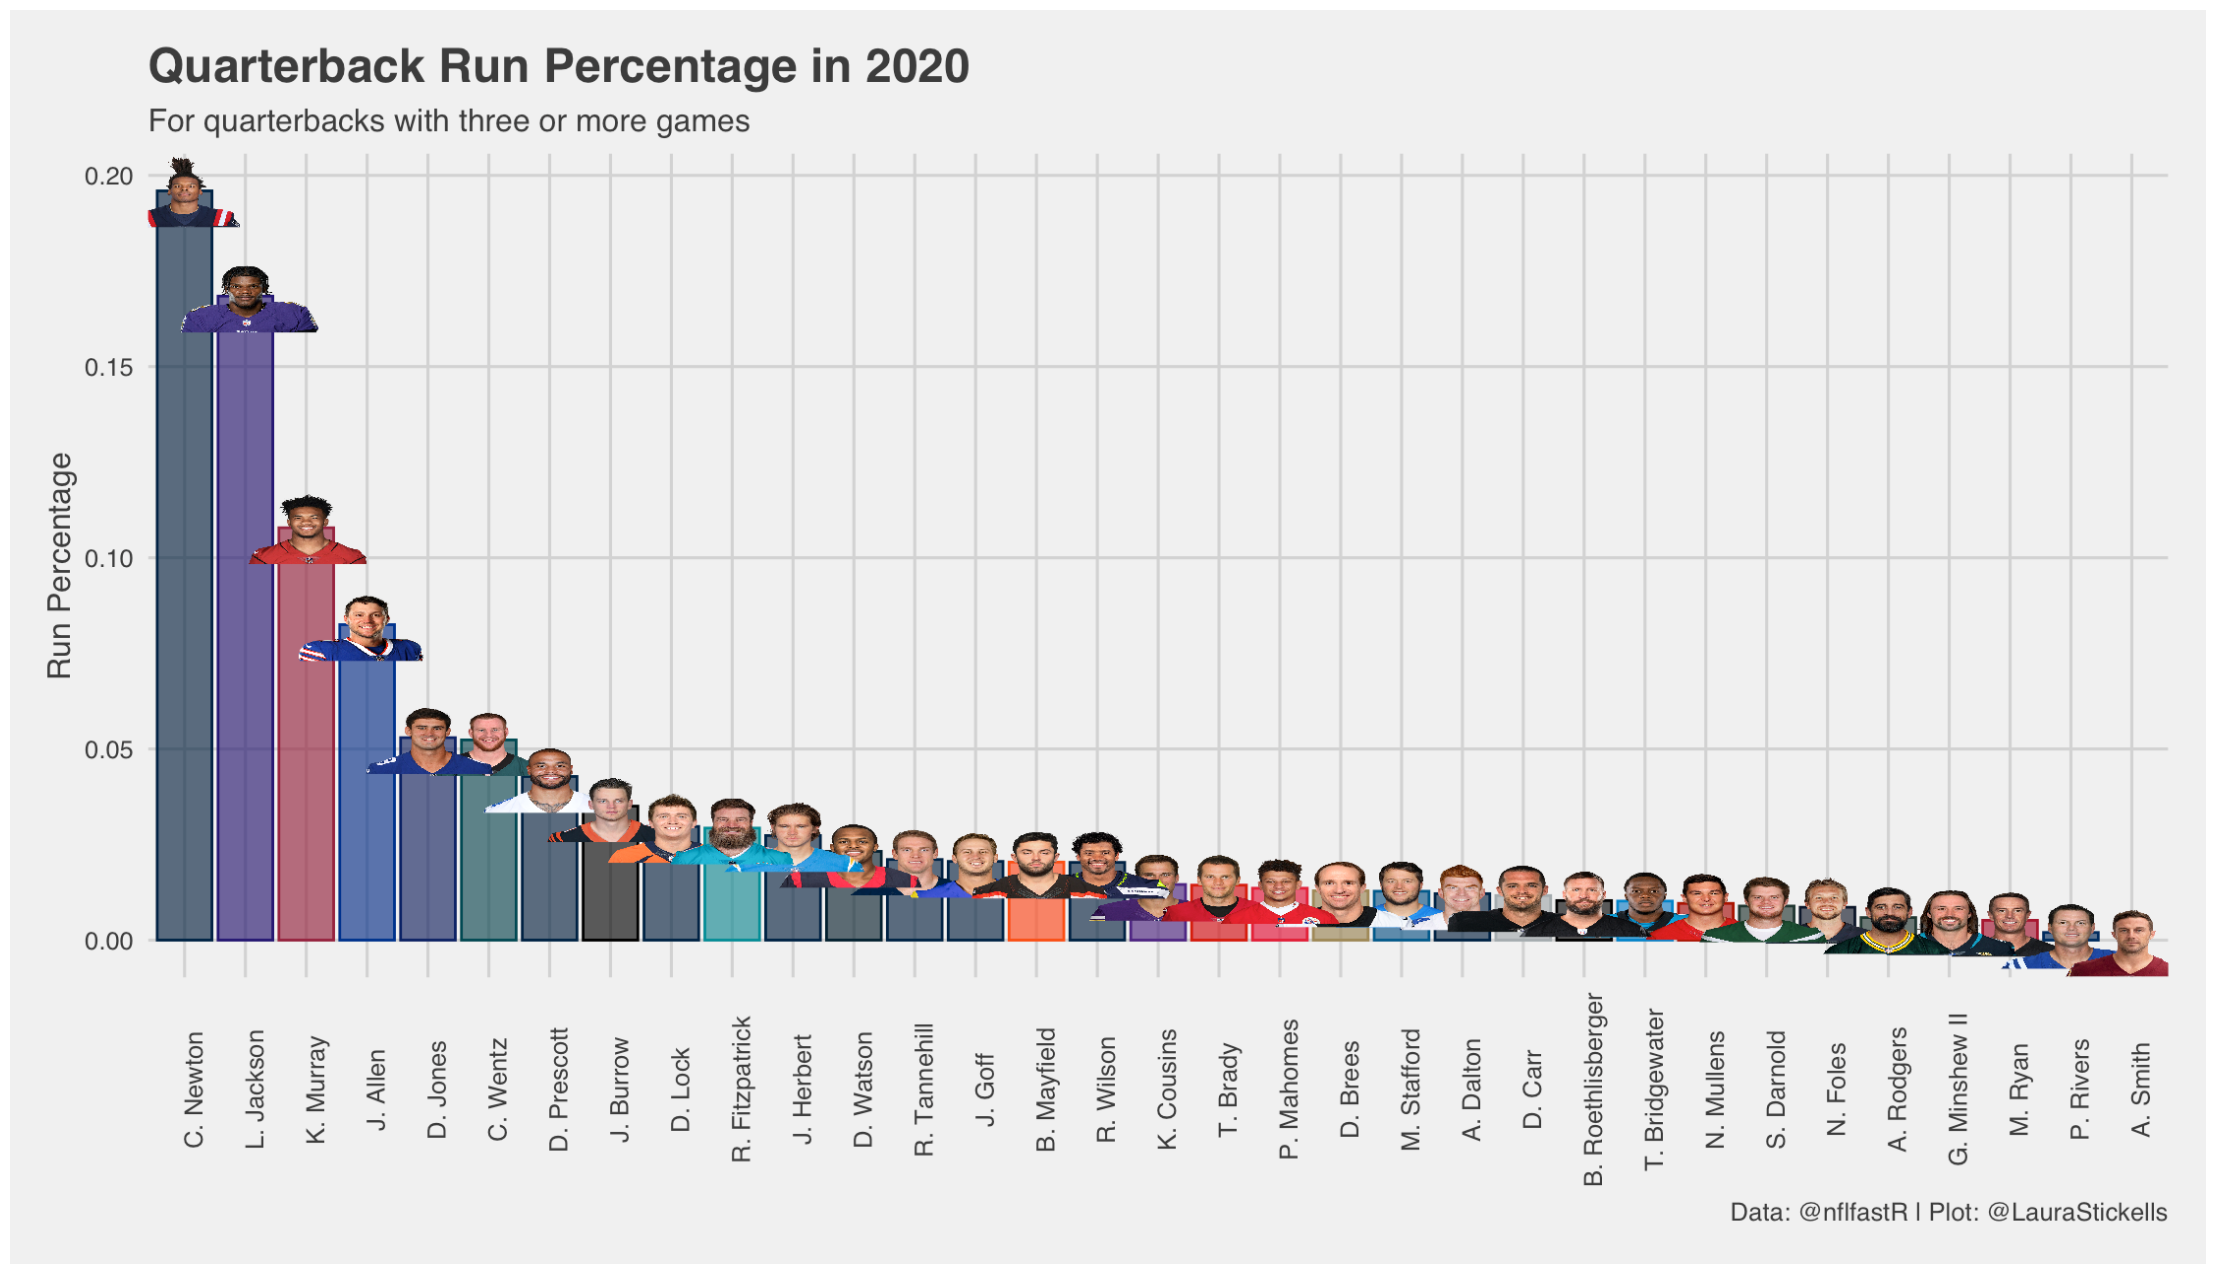
To the Patriot’s credit, Newton is running on average more than any other quarterback this season and about 10 times more than Tom Brady did during his time in New England. But still, Newton makes up for only 24% of the Patriots’ overall rushes this season (not including week 4 when he didn’t play). Murray accounts for 18% of the Cardinals’ runs, and Jones is the rusher 8% of the time for the Giants.
Now I am not saying these teams should be running the ball more. But, on the plays when they are already planning to run, instead of handing it off to a running back, it might make sense to draw up a quarterback run instead. I understand that protecting the quarterback is important and isn’t something to go crazy with, but an extra run here or there could make a significant difference in overall performance.
As for Jackson, who accounts for 21% of Baltimore’s rush attempts and ranks second overall in quarterback run percentage this year, maybe give him a break.
That’s all for this post, send me feedback if you have any! My contact info is at the bottom of the page. And my R Markdown is linked here as well.
* (QB Rush attempts)/(QB Rush attempts + Pass attempts). For the purposes of this post, I eliminated quarterback kneels from rushing attempts. Pass attempts includes quarterback scrambles.
** It’s worth noting that only seven of league’s quarterbacks have a positive correlation between run percentage and Total QBR, albeit most being statistically insignificant. This gave me pause. It’s possible that the way QBR is calculated gives more weight to QB runs. Because QBR splits the value between and quarterback and receiver on pass attempts, it seems possible that quarterback runs, which aren’t split with another player, inflate QBR. Or maybe all teams could benefit from running their quarterback more. If someone actually knows the answer to this, let me know!