Daniel Jones isn't attempting as many risky passes as you think, but when he does, hold your breath.
By Laura Stickells | November 8, 2020
After the first half of Monday night’s game between the New York Giants and the Tampa Bay Buccaneers, I managed to trick myself into thinking that maybe Daniel Jones could finally notch his second win of the season. After tripping over his own feet on what would have otherwise been a sure touchdown the week before, I thought Jones could really use a morale boost.
But no such luck.
In case you missed it, Bucs head coach Bruce Arians provided a good summary of the second half:
"The young quarterback – he's still trying to do too much," Arians told reporters after the game. "It cost them basically the ballgame throwing those two picks. God bless him – he is hard to handle and he's a kid that thinks he can make a play."
This week, I committed to diving down a deep rabbit hole in an attempt to find some sort of explanation as to why Jones is a turnover machine. And is his decision making really as bad as it seems?
Before I get started, it’s worth noting that according to Pro Football Focus, the Giants pass block is the worst ranked in the league. But it’s also worth noting that I’ve screamed, “THROW IT AWAY!” at my TV while watching the Giants to no avail more often than feels appropriate.
I started with a basic question: how often is he actually giving up the ball? Through week eight, Jones has turned the ball over 12 times on 9 interceptions and 3 fumbles for a turnover rate of 3.6%*. That’s the sixth highest percentage out of the 34 quarterbacks with 100 or more dropbacks this season. His fumbles lost rate is the 4th highest in the league and his interception rate is 10th highest.
Clearly those numbers aren’t good, but it’s better than last year. In 2019 his 3.9% turnover rate was ranked 33 out of the 34 quarterbacks with 212 or more dropbacks**. The only quarterback worse than Jones was the blind Jameis Winston.
Jones’ 23 sacks this season are the third most in the NFL. His sacks per dropback percentage (6.95% for eighth worst) is marginally better. But looking only at early downs, when the necessity to make a play isn’t as great, he’s 3rd worst in the league, taking sacks on 7% of early down dropbacks — not a sign of great decision making.
But here is when this rabbit hole got a little twisted. I used a density plot to visualize the distribution of the completion probability*** for all of Jones’ pass attempts this season and compared it to the rest of the league in an attempt to mimic risky decision making. (Although I acknowledge that low completion probability is not a comprehensive equivalent to high risk, I’m confident there is at least some legitimate correlation. It’s also the best play-by-play stat available to me.)
Considering Jones’ high interception rate and low completion percentage (61.8% — 26th out of 33 quarterbacks) and given his record of questionable decision making, I expected to find him attempting more passes with a lower completion probability compared to the rest of the league.
But Jones’ density plot nearly mirrored that of the rest of the league’s quarterbacks. Surprisingly, one of the slight differences is that Jones has thrown fewer passes with a completion probability under 50% than the average quarterback. Just for fun and to see if I was onto something, I graphed the completion probabilities for a few other QB’s (Russell Wilson, Tom Brady, Aaron Rodgers and Drew Lock). Their distributions looked much more distinct.
I also graphed Jones’ interceptions as tick marks below the graph. From looking at the density plot, I can see that although only about 10% of his passes have a completion probability under 50%, they account for 4 of his 9 interceptions. Two of them were on Monday night. That seems correlated to me.
Just to be sure I checked my hypothesis by building a linear model, using Jones’ completion probability to predict his interceptions. And yes, there is a statistically significant negative correlation (-0.20) between the variables. I also built a model using all 2020 passers for comparison purposes. When graphed together, it’s clear Jones is more likely to throw an interception on a difficult pass than an average quarterback.
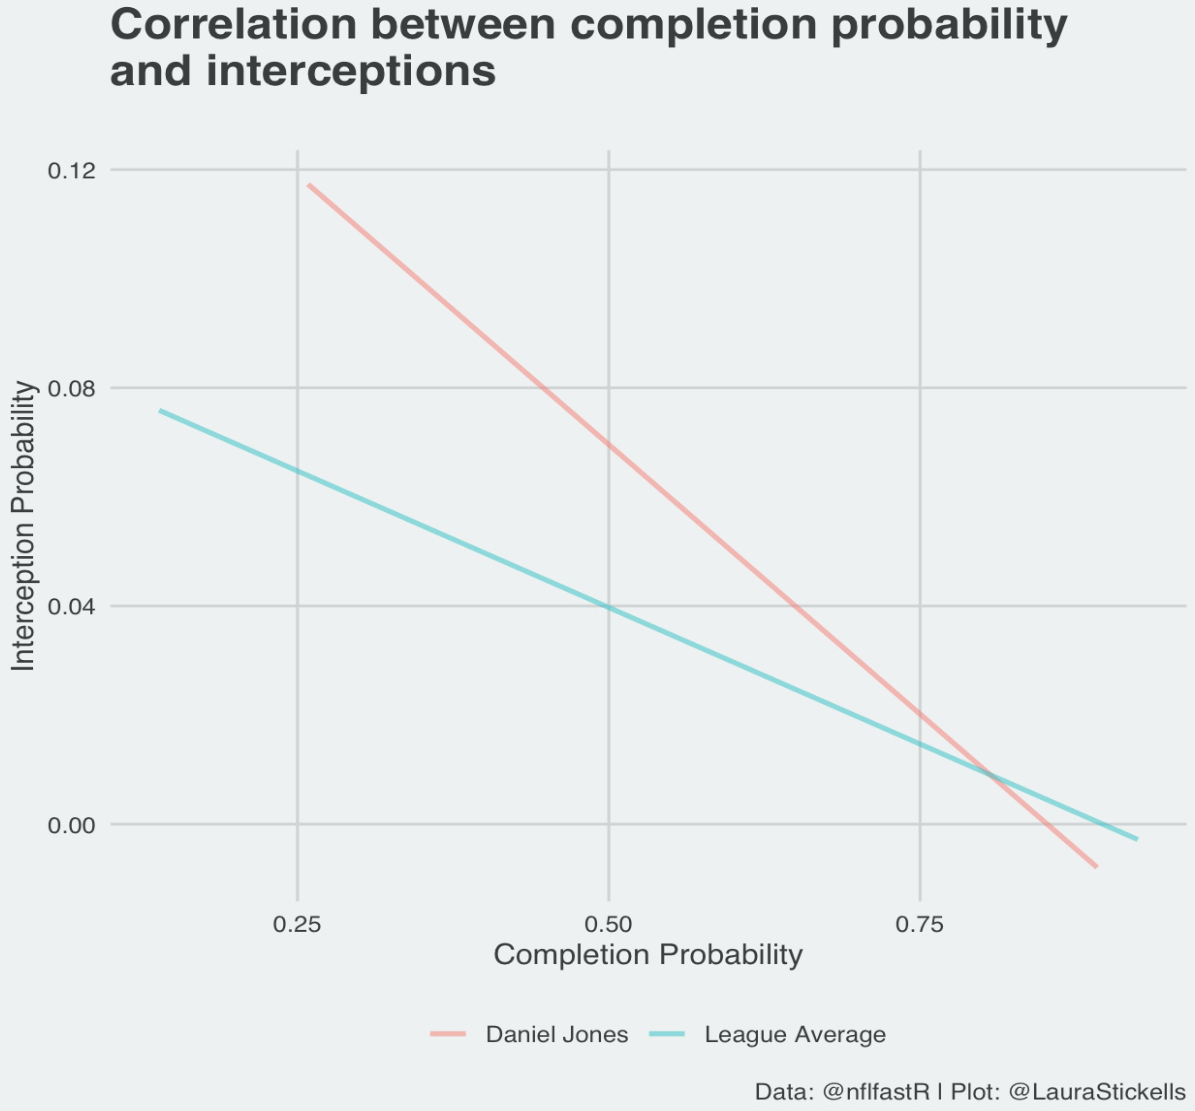
Looking at these numbers, it seems that Jones isn’t typically making riskier passes than the rest of the league. But when he does attempt them you notice because they often don’t end well.
That’s it for my second blog. Thank you for reading! If you like it let me know! And if what I said made absolutely no sense, definitely let me know!
* Calculated based on quarterback dropbacks (pass attempts, sacks and scrambles).
** Threshold adjusted to account for the entire 2019 regular season.
*** An NFLfastR stat which uses comparable game situations to calculate the probability of a complete pass.
I've attached my R Markdown file for anyone who's interested in taking a look.